Spatialworks Digital Twin
Led 0→1 product design for the Spatialworks Digital Twin ecosystem at Hiverlab. Established a scalable design system, contributed to a 25% increase in sales, and secured B2B partnerships with Keppel Shipyard and DB Schenker.
The problem
Hiverlab was pitching digital twin contracts to enterprise clients with only a concept, no product to show. Industrial clients like crane engineers, logistics managers, and safety officers needed to connect IoT sensor data to 3D models and get automated alerts when something went wrong. The hard part: they were not developers and did not want to be. They had to set this up themselves.
How it came together
Context
I joined as Lead Product Designer in March 2020, before the product existed. The team had 8 engineers, no design system, and a first contract that had to close within 4 months. My job was to go from zero to a working product, lead a growing design team, and make sure non-technical industrial users could actually operate what we built.
Note: the designs shown are redesigned versions due to NDA constraints.
Research
I went on-site to Keppel FELS Tuas to watch crane operators monitor their 400-foot cranes. Paper logs. Manual environmental checks every 2 hours. No automated alerts. A temperature spike between checks went unnoticed until it was already a problem. Engineers spent hours on checks that should have been automatic.
At DB Schenker, logistics managers tracked energy consumption and equipment performance in spreadsheets. They could not tell a cooling unit was underperforming until it failed. No alerts, no trends, no way to act proactively.
I ran a user story mapping workshop with engineering and BD to turn these observations into requirements. Three stories defined the MVP: visualise and monitor sensor data on the crane model, get notified of crane faults to minimise downtime, and get notified of any warning or critical issue to protect personnel safety.
How I structured it
The core flow was clear once I mapped the story: connect data source, import 3D model, attach data charts, configure trigger alerts. Four sequential steps, built as a wizard so users could not skip ahead and get confused.
I mapped every state, including the edge cases: the data source disconnecting mid-setup, the model file in an unsupported format, an alert firing while the user is offline. In industrial software, edge cases are not edge cases. They are the most critical scenarios.
Design decisions
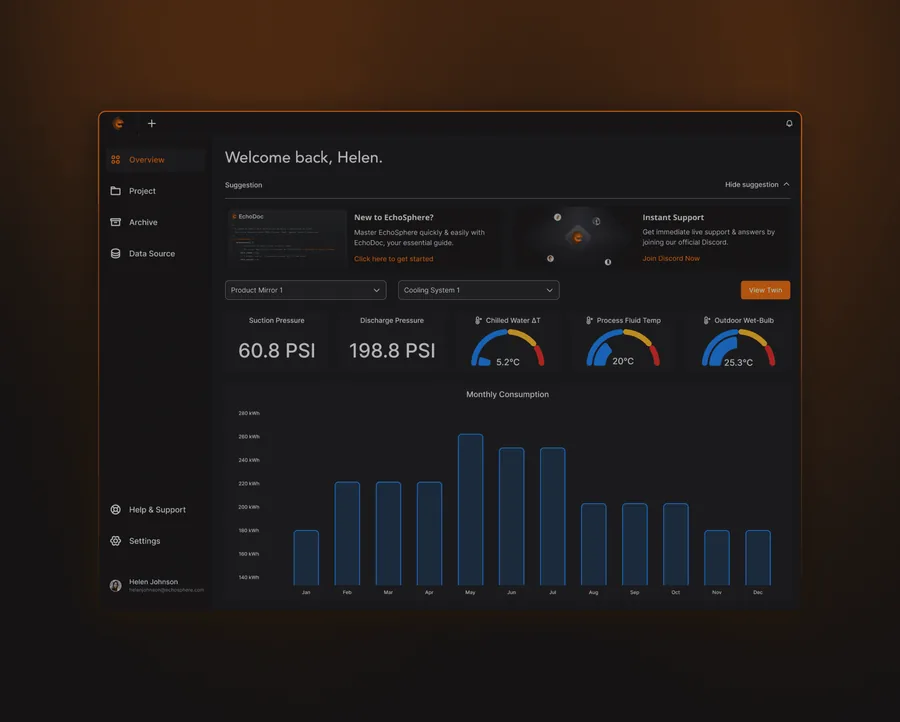
The data source connector is a 5-step wizard supporting 5 sensor types, with a live preview panel showing incoming readings on connection. Users confirmed the data was real before attaching anything to the model.
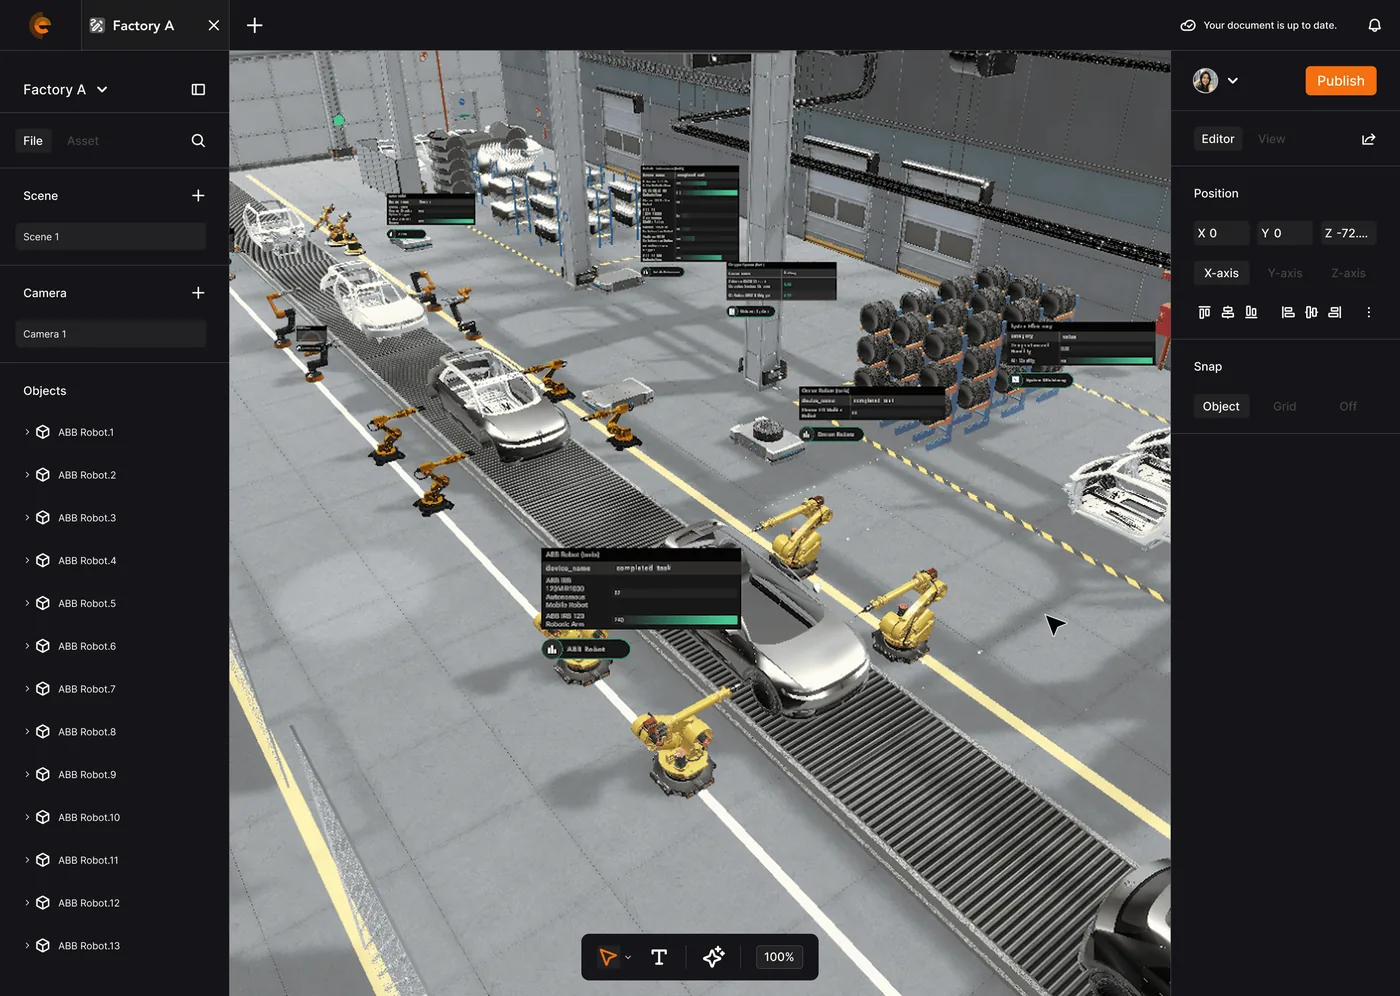
Clicking any asset in the 3D viewport opens a context panel with 4 options: add data chart, add annotation, add scene camera shortcut, adjust position. No abstract settings panel. Everything is spatial and direct.
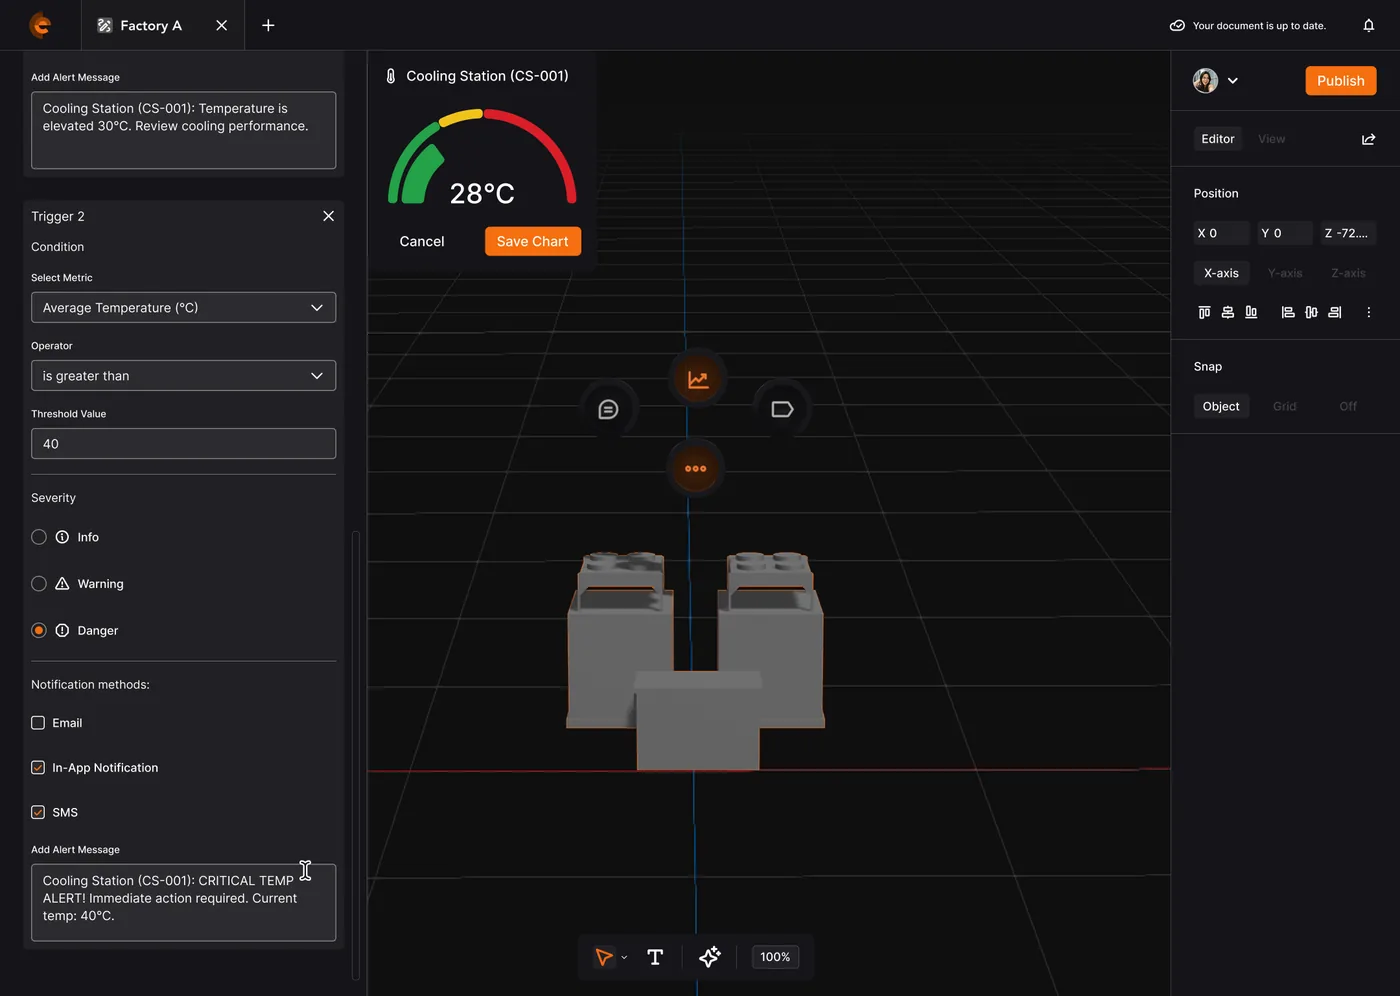
The trigger alert builder is no-code. Users define if-then rules (if temperature exceeds threshold then send notification) without SQL or scripting. Three severity levels, Information, Warning, and Danger, each with different notification behaviour so engineers can tune the urgency.
What it became
The platform shipped and won enterprise contracts with Keppel, DB Schenker, Hamburg Port, Omron AGV, HP Indigo, and JamK Cyber Sec. Six clients in 3 years, each on a different use case. Keppel used the alert system for crane safety monitoring, DB Schenker for energy consumption tracking, and Hamburg Port for asset monitoring across its port logistics network.
The product went from a prototype I built in the first 4 months to a commercial platform with recurring contracts. That came from getting the non-technical user experience right. Industrial clients bought because their engineers and safety officers could operate it themselves.
Process
Challenge context
Research
MVP user stories
Define & structure
Key solutions
5-step sensor data connector wizard
Supports 5 sensor types. A live preview panel shows incoming readings on connection, so users confirm the data is real before attaching anything.
Spatial chart attachment on the 3D model
Click any asset in the viewport to open a context panel. Add charts, annotations, or camera shortcuts directly on the model, not from an abstract settings page.
No-code alert trigger builder
An if-then condition builder, no SQL or scripting. Three severity levels (Information, Warning, Danger), each with different notification behaviour.
Results overview
All screens
Outcomes